#Forecasting #timeseries #datascience #machinelearning #ForecastingPrinciplesAndPractice
2024-03-27 chapter 2
- 2.4 Seasonal plots | Forecasting: Principles and Practice (3rd ed)
- Different metrics may have seasonality at different times. (Different SOs)
Application ideas: - to diagnose a time series, make a plot of metric over time colored by year. - Helps pick up how to do feature engineering. - Plot each day, over time of day. - Plot each day over day of week - Facet by month, plot revenue over year. - Plot Y ~ X’s. - Plot Y ~ lag (Y) to identify seasonality. - Plot autocorr(Y) using Statsmodels. Group by day. 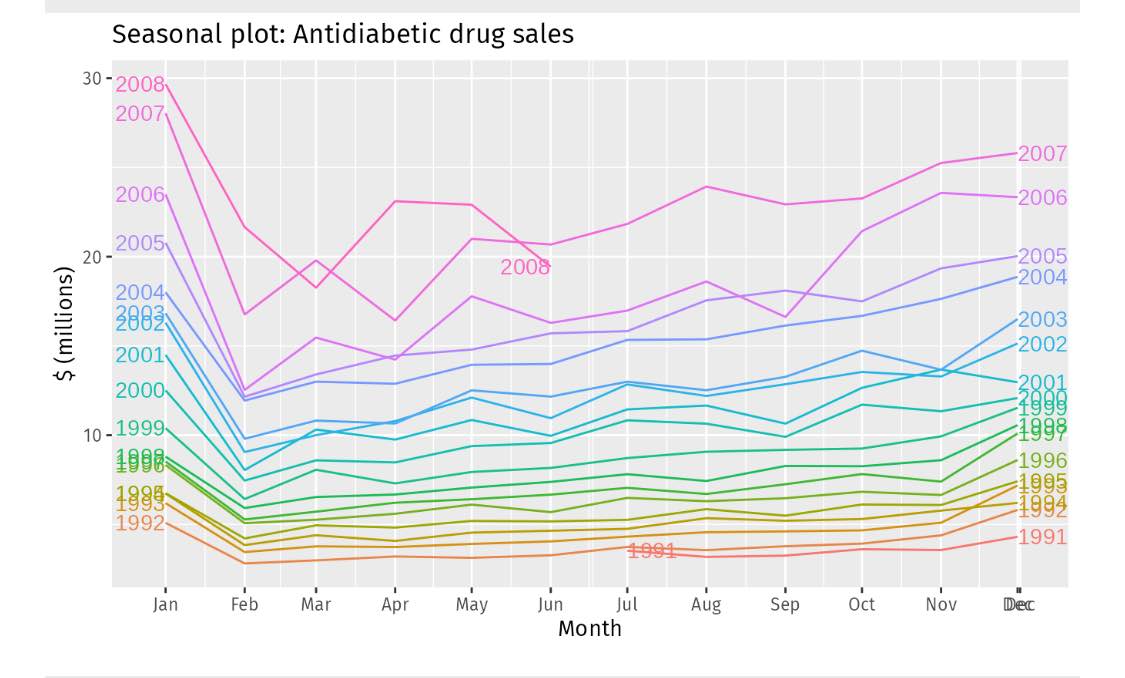
2024-03-15
Chapter 1 Getting started | Forecasting: Principles and Practice (3rd ed)
1.4 Forecasting data and methods | Forecasting: Principles and Practice (3rd ed)
- Two types of models: incorporate external data or is only based on time events.
- Judgmental forecasts vs qualitative forecasts. (Superforecasters )
Occasionally, old data will be less useful due to structural changes in the system being forecast; then we may choose to use only the most recent data
2024-03-11
- People have always wanted to forecast, such as ancients using the shape of sheep liver to predict the future. Tarot cards, prophets, etc have been religious and spiritual forecasters.
- Forecasting has always been a guessing game.
- Sometimes you can use algorithms to mine historical data for forecasting, but that assumes the future will be like the past.
_________________________
Bryan lives somewhere at the intersection of faith, fatherhood, and futurism and writes about tech, books, Christianity, gratitude, and whatever’s on his mind. If you liked reading, perhaps you’ll also like subscribing: